MLB Bettors
An MLB betting ecosystem built around identifying exploitable pitcher vs batter matchups, weighting park factors, and pricing the market in real time to uncover positive EV opportunities across props, sides, and totals.
Powered by the SwishLand MLB Dashboard and a process trusted by bettors who rely on disciplined, data-driven betting every day.
Daily Bets. Proven Process.
Market-Based Pricing.
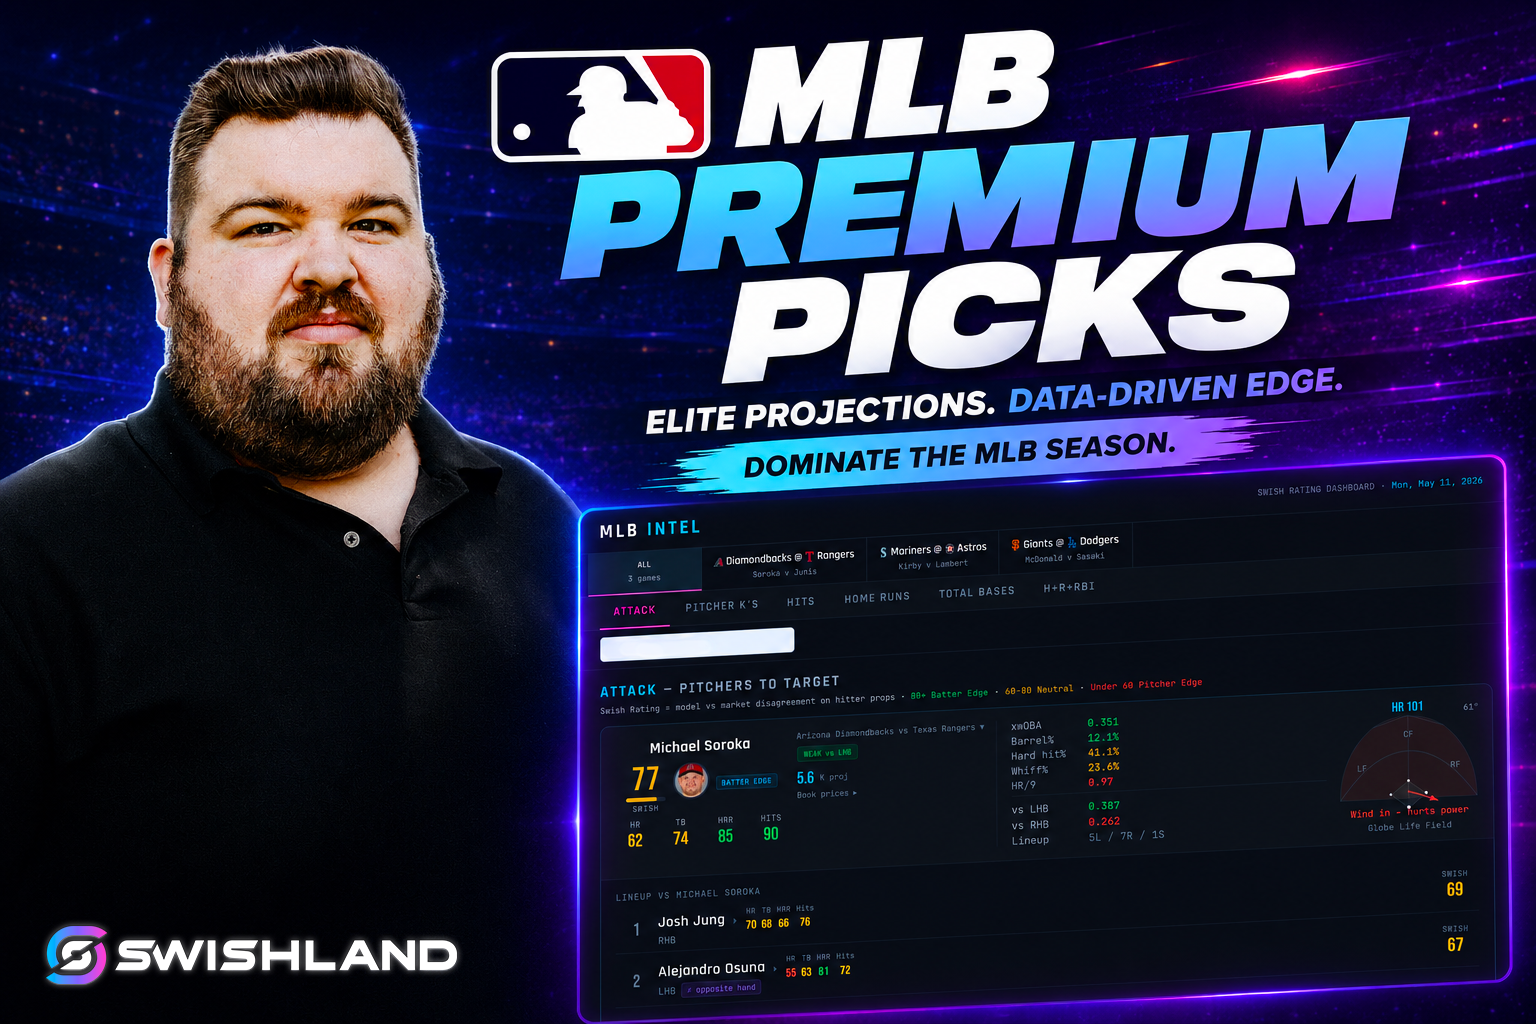
Follow Matty's daily MLB bets with full write-ups and transparent tracking throughout the season. His process focuses on identifying pitcher weaknesses versus batter tendencies, then combining those matchups with park factors to build stronger projections and uncover value across the board.
Every play is priced through the SwishLand MLB Dashboard to target positive EV opportunities only — taking advantage of weak spots in sportsbook pricing across props, sides, and totals. Daily cards are built around disciplined market analysis and long-term profitability, not chasing short-term wins.
Nothing You Don't.
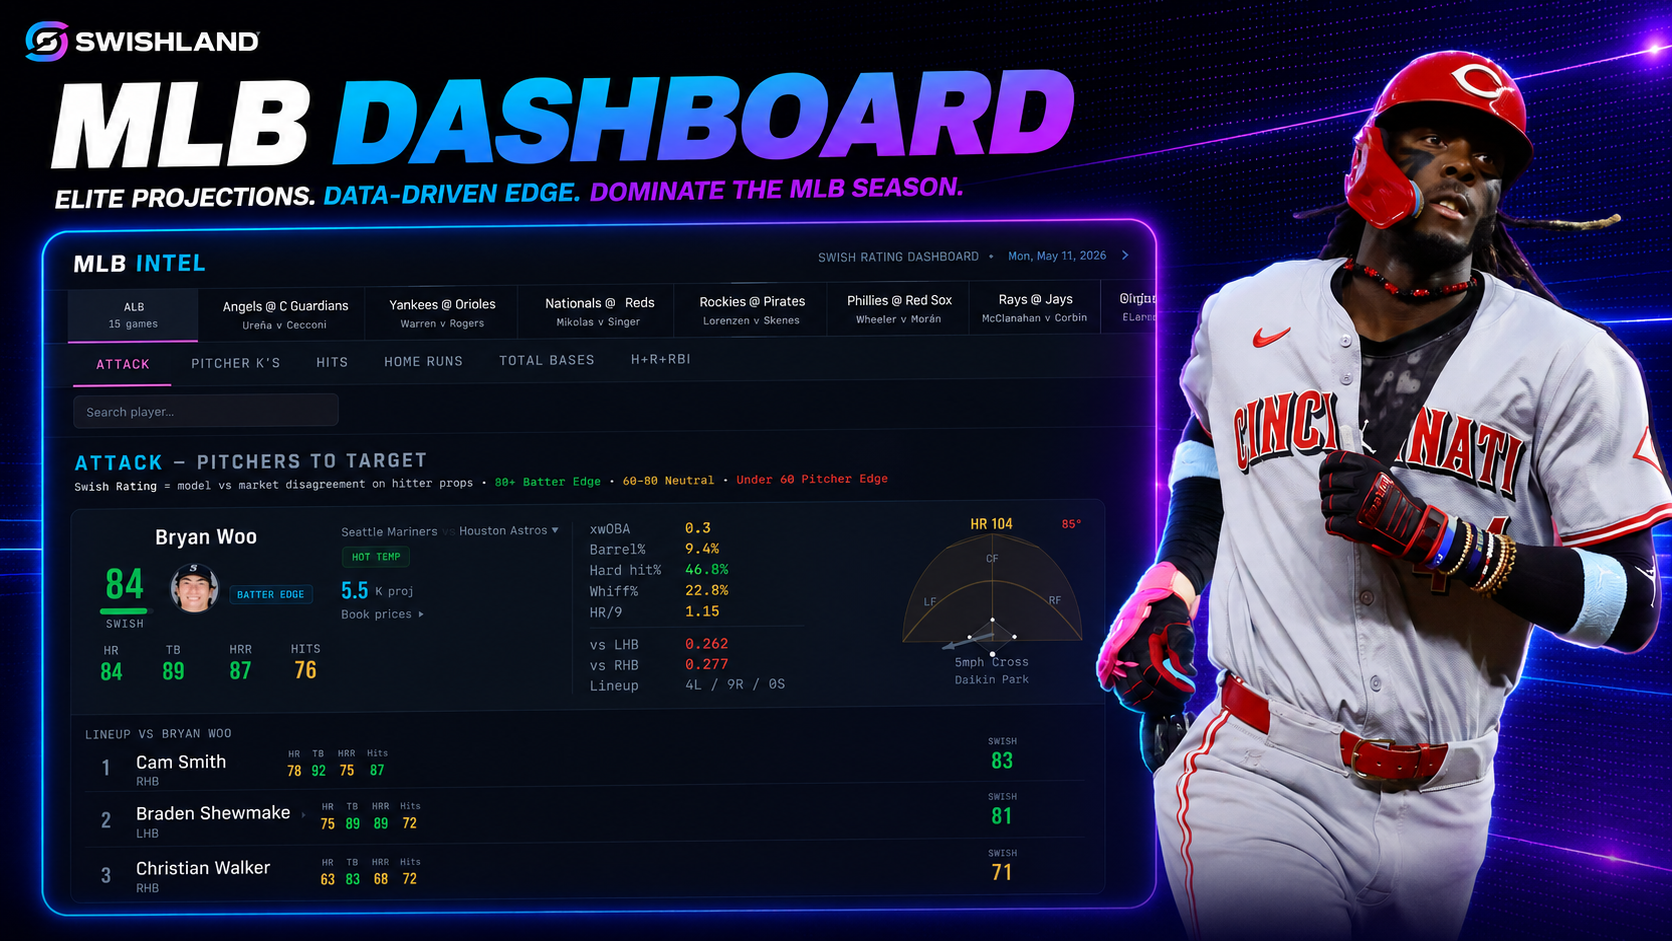
The dashboard does the research for you. Here's what it covers on every single game.
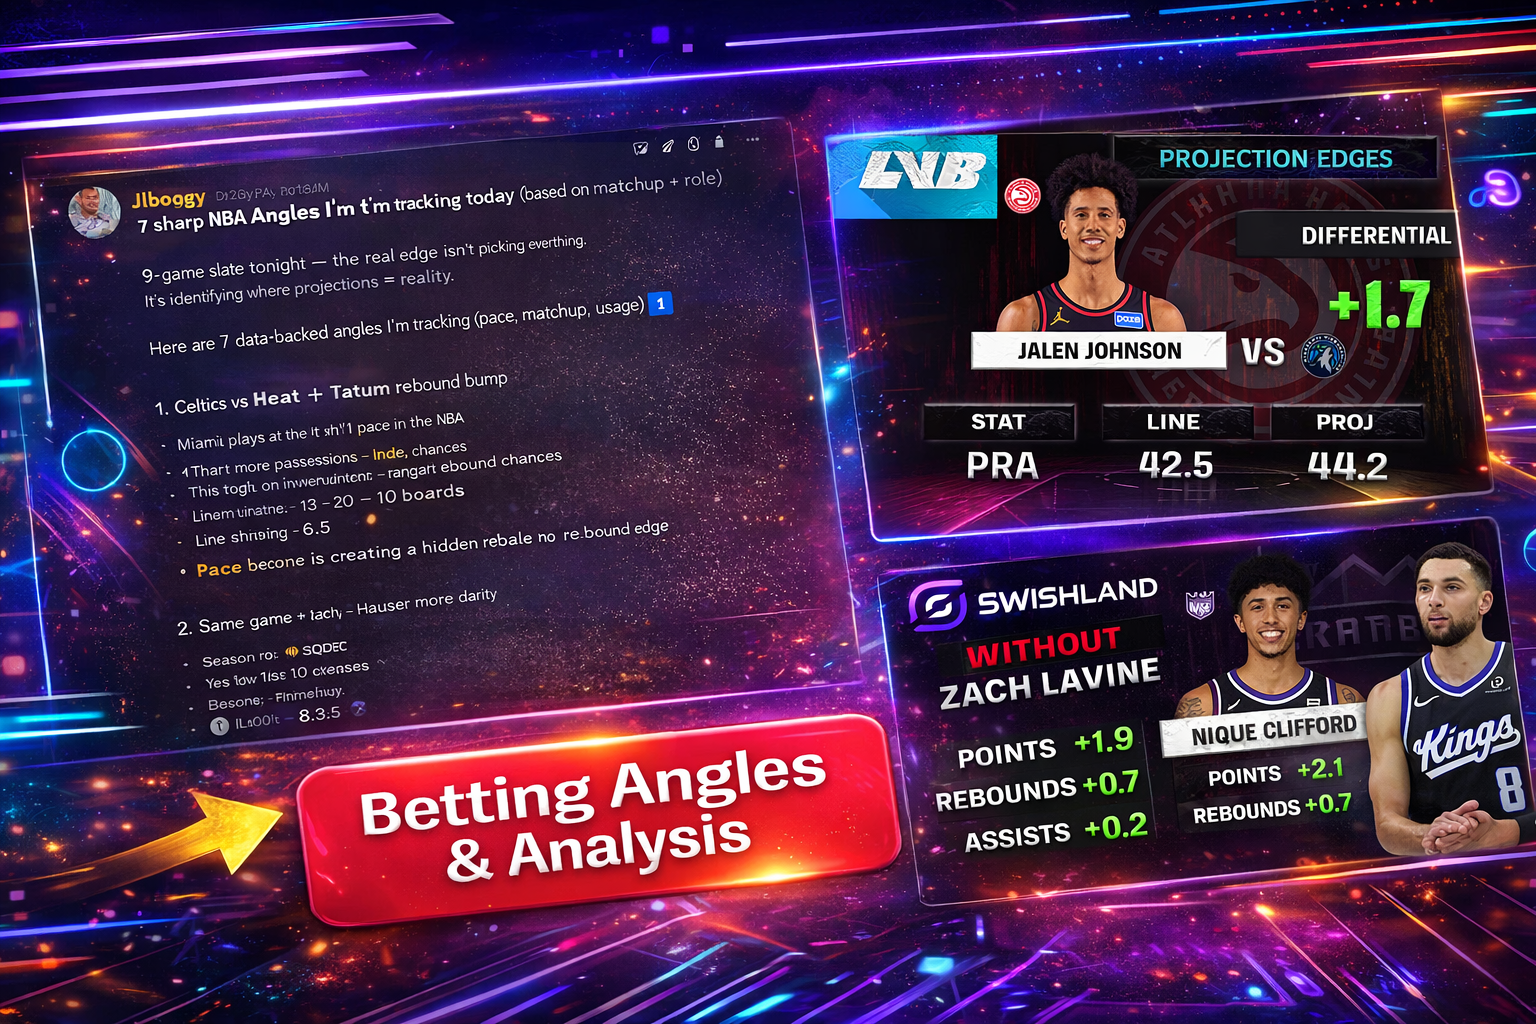
Pitcher Matchups
Every starting pitcher is broken down by how they match up against the batters they'll actually face that night — not just their season averages.
Batter Projections
Each batter gets a projection for hits, home runs, total bases, and more — based on who's pitching, the ballpark, and recent performance.
Park Factors
Some ballparks help hitters. Some suppress scoring. Every projection is automatically adjusted based on where the game is being played.
Weather
Wind, temperature, and humidity all change how the ball travels. We pull live weather and factor it into every projection automatically.
Bullpen Tracking
When a team's relief pitchers are overworked, the other team scores more. We track workloads so you know when a bullpen is gassed.
The Swish Rating
One number that tells you where the sportsbook is furthest off. The higher the rating, the bigger the gap between our projection and the book's line.
The Swish Rating isn't about who the best player is — it's about where the sportsbook is most wrong. Here's how it works.
We Project the Player
Using matchup data, park factors, weather, and recent performance, we estimate what a player should actually do tonight — strikeouts, hits, home runs, total bases.
We Compare to the Book
Then we look at what the sportsbook is pricing that same player at. If our projection says 7.2 strikeouts and the book says 5.5 — that's a gap.
We Score the Gap
The bigger the gap between our number and the book's number, the higher the Swish Rating. A high rating means the book is way off — and that's where your edge is.
You Bet the Best Ones
Sort by Swish Rating and the best opportunities rise to the top. No guessing, no gut picks — just the plays where the math says the sportsbook made a mistake.
This is the real dashboard, live, running on tonight's final confirmed game. Every tab works — Swish ratings, pitcher K's & outs, hits, home runs, total bases, pitch-matchup drilldowns, book prices and weather. The full version covers every game on the slate.

YOU'VE SEEN THE PREVIEW
Create a free account for unlimited demo access — or start your free trial to unlock the full dashboard with every game, every pitcher, every edge.
The Wins Are Real.
Daily edges, winning tickets, live conversation with Josh, Travis, and the community. This is where it all starts — join for free and see what we're about.